Mathieu GuglielminoDrawing on Paper #2 — DeforestationDrawing on Paper is a weekly case study to visualize a topic. This week: Deforestation. Follow me on Twitter and subscribe to the…·5 min read·Dec 24, 2021----
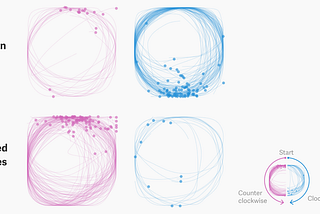
Mathieu GuglielminoinNightingaleThe Five Rules of Harmony in the Art of Federica FragapaneData visualization as an art should strive for harmony. Here’s how award-winning information designer Federica Fragapane achieves it.·9 min read·May 5, 2021--1--1
Mathieu GuglielminoinNightingaleThe Rhetoric Behind the Coronavirus Propaganda MapsHas the power of maps got out of control?·16 min read·Apr 1, 2021--1--1
Mathieu GuglielminoinNightingaleFeeling Scale Is Necessary to Inspire ActionVisualization can transcend the limited grammar of numbers·8 min read·Feb 26, 2021--3--3
Mathieu GuglielminoEvery data lab need data storytellers. Here’s 10 reasons why.Data labs may well be the corporate invention of the decade. With the unstoppable ascension of artificial intelligence and its nearest…·9 min read·Jan 6, 2021--1--1
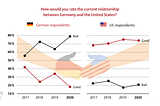
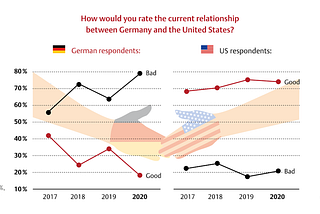
Mathieu GuglielminoDivergent Opinions on Transatlantic Alliance — #MakeOverMondayImproving this #MakeOverMonday using Jacques Bertin “Semiology of Graphics” framework and d3.js.3 min read·Dec 23, 2020----
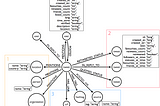
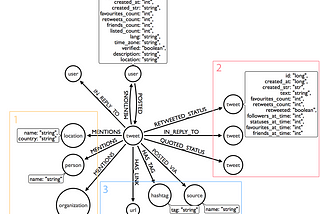
Mathieu GuglielminoPart 2. Twitter graph analysis with GremlinIn the previous article I was explaining how we could build a graph database of the Twitter stream using twitter4j and Apache TinkerPop on…6 min read·May 3, 2018----
Mathieu GuglielminoPart 1. Twitter graph with HBase, Tinkerpop and twitter4jToday we’ll look into the creation of a Twitter graph, using the capabilities of the distributed storage system of Hadoop, HBase, and the…6 min read·Apr 29, 2018----